
Crash Data
Bronx Car Accident Hotspots: Deadliest Roads
The Bronx had 10,028 crashes in 2024 and 54 traffic deaths. Crash data for the deadliest roads and intersections.

In this report
Key Finding
The Bronx recorded 10,028 crashes and 4,416 injury crashes in 2024, and NYC DOT counted 54 traffic deaths. East 138th Street has the highest fatality rate per mile of any road in NYC: 12 people killed on a 1.5-mile stretch between 2014 and 2023.
The Bronx recorded 10,028 crashes in 2024. Of those, 4,416 resulted in injuries. NYC DOT counted 54 traffic deaths on Bronx roads that year, the third-highest of any borough. The Bronx carries one of the highest per capita serious injury burdens in the city.
7.1
fatalities per mile on East 138th Street between 2014 and 2023, the highest rate of any road in New York City. 12 people killed on a 1.5-mile stretch.
In 2025, fatalities dropped to 33, a 39% decline and the sharpest improvement of any borough. But the underlying road conditions that produce these crashes have not changed. The same intersections, corridors, and expressways that killed and injured people in 2024 remain largely unaltered.
Bronx by the Numbers
NYC DOT’s January 2026 report on 2025 traffic fatalities places the Bronx in context:
| Borough | 2024 Deaths | 2025 Deaths | Change |
|---|---|---|---|
| Queens | 74 | 57 | -23% |
| Brooklyn | 69 | 63 | -9% |
| Bronx | 54 | 33 | -39% |
| Manhattan | 44 | 39 | -11% |
| Staten Island | 12 | 13 | +8% |
The fatality decline is real. But it does not tell the full story. The Bronx still produced 4,416 injury crashes in 2024, and the underlying road conditions that produce them remain in place.
Distracted driving is the leading cause. In 2022, distracted driving caused 37% of all Bronx crashes. NYPD data from 2021 breaks down the full picture:
| Cause | Crashes (2021) |
|---|---|
| Distracted driving | 2,660 |
| Improper passing | 1,010 |
| Failure to yield | 679 |
| Unsafe speed | 590 |
| Running red lights | 374 |
| Intoxication | 233 |
Distracted driving alone caused more crashes than the next three categories combined.
East 138th Street: NYC’s Deadliest Road Per Mile
East 138th Street holds a distinction no road wants: the highest fatality rate per mile of any road in New York City. Twelve people were killed on a 1.5-mile stretch between 2014 and 2023. That is a rate of 7.1 fatalities per mile.
For comparison, Woodhaven Boulevard in Queens had 18 total deaths over the same period, but its longer length produces a rate of 4.4 per mile. The BQE through Brooklyn, one of the most feared roads in the city, does not match 138th Street’s per-mile lethality.
The corridor runs through Mott Haven and Port Morris, neighborhoods where heavy industrial truck traffic mixes with residential streets. Wide lanes designed for freight movement encourage speed.
Pedestrian crossings are long and exposed. The road connects the Third Avenue Bridge, the Willis Avenue Bridge, and the Bruckner Expressway, funneling bridge and highway traffic through a residential area.
Community District 1, which includes the 138th Street corridor, is consistently among the five most dangerous districts citywide for pedestrian injuries and deaths.
Bruckner Boulevard: The Bronx’s Most Dangerous Intersection
Bruckner Boulevard and St. Ann’s Avenue is the most dangerous intersection in the Bronx. Since January 2022, 8 people have been killed or seriously injured there in 5 crashes: 5 motorists and 3 pedestrians. That figure comes from Transportation Alternatives’ December 2025 analysis of the most dangerous intersections in New York City.
Bruckner Boulevard is an elevated expressway above and a surface arterial below. The surface road runs through Mott Haven with wide lanes, fast-moving traffic, and long pedestrian crossings. St. Ann’s Avenue adds heavy local traffic to the mix.
The Bruckner corridor as a whole recorded 333 crashes, 164 injuries, and 3 fatalities in 2023. The expressway functions as a dividing line through South Bronx neighborhoods, and the communities on either side bear the injury burden.
Major Deegan Expressway: The Borough’s Deadliest Highway
The Major Deegan Expressway (I-87) runs the length of the Bronx along the Harlem River. In 2023, the expressway recorded 525 crashes, 242 injuries, and 6 fatalities.
Those numbers make the Major Deegan the deadliest highway in the Bronx by total crash volume. The expressway carries heavy truck traffic connecting New England and upstate New York to Manhattan.
Merge zones and interchanges at the Cross Bronx, the George Washington Bridge approaches, and Yankee Stadium create choke points where speed differentials produce rear-end collisions and sideswipe crashes.
The Cross Bronx interchange is covered in detail in our analysis of Cross Bronx Expressway crashes. That intersection at Jerome Avenue alone produced 13 crashes, 24 motorist injuries, and 1 death in 2021.
Grand Concourse, Fordham Road, and White Plains Road
Three arterial corridors account for a concentrated share of Bronx injuries outside the expressway system.
Grand Concourse
The Grand Concourse is 180 feet wide and 4.5 miles long. Between 2009 and 2013, 12 pedestrians were killed and 43 seriously injured on this road. Its width encourages speeding and forces pedestrians into crossings that can take 30 seconds or more to complete.
NYC DOT installed speed cameras along the Grand Concourse, and the road has seen incremental safety improvements. But the fundamental geometry, a boulevard designed for automobile parades in the 1920s, still treats pedestrians as an afterthought.
Grand Concourse and East 170th Street recorded 2 pedestrian fatalities at a single intersection in one year. The corridor through Community District 4 (Highbridge, Concourse) is a Vision Zero priority area.
Fordham Road
Fordham Road stretches 2.3 miles from the University Heights Bridge to the Bronx River Parkway. Along that distance, 38 people suffered serious pedestrian injuries and 2 were killed.
More than 80,000 people walk Fordham Road daily. Approximately 130,000 bus riders use the corridor. It is the commercial heart of the central Bronx. The volume of foot traffic, bus stops, double-parked delivery vehicles, and turning cars creates constant conflict.
White Plains Road
White Plains Road runs north-south through the eastern Bronx. Data shows it produces more severe injuries than 90% of other roads in the borough. The road passes through Unionport, Pelham Parkway, and Williamsbridge, carrying mixed residential and commercial traffic along a corridor that lacks the safety infrastructure of the busier west-side arterials.
Jerome Avenue
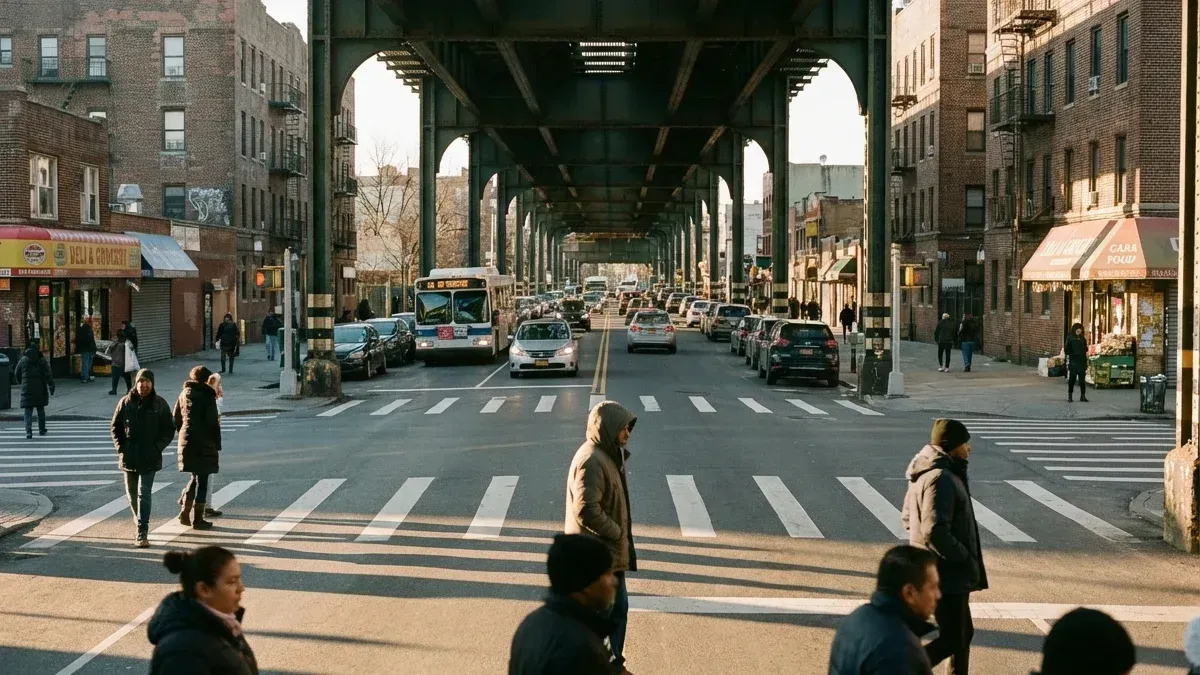
Jerome Avenue recorded 249 crashes, 123 injuries, and 3 fatalities in 2023. The intersection of Jerome Avenue and Clifford Place stands out: 4 crashes, 5 injuries, and 2 deaths at a location with no traffic controls. The elevated subway tracks above Jerome Avenue create visual obstructions and dark conditions at street level.
The Bike Lane Gap
In 2024, 451 cyclists were injured in the Bronx and 4 were killed. That is a significant number for a borough where cycling infrastructure barely exists.
Only 6% of New York City’s protected bike lanes are in the Bronx. Every borough has approximately the same rate of bicycle ridership, but the Bronx has a fraction of the protection. Nearly 100% of cyclist deaths citywide occurred on streets without protected bike lanes.
Over the past four years, the city has added 13.9 miles of new bike lanes in the Bronx, including 4 miles of protected lanes on Bronxdale Avenue, Hunts Point Avenue, Rosedale Avenue, and Soundview Avenue. Those improvements are concentrated in the southeastern Bronx.
Large sections of the borough, including the Grand Concourse corridor and Fordham Road, have no protected cycling infrastructure.
Community Districts 8, 14, and 17 (Mott Haven, Hunts Point, and Fordham) rank among the five most dangerous districts citywide for pedestrian injuries. These same districts have the least cycling protection.
The Pedestrian Toll
In 2021, 1,134 pedestrians were injured in Bronx traffic crashes and 413 cyclists were hurt. The South Bronx concentrates the highest numbers. Mott Haven, Hunts Point, and Melrose produce pedestrian injury rates that consistently exceed the citywide average.
The pattern ties directly to road design. The Bronx’s arterial network was built to move cars through the borough, not to protect people walking across it. Wide roads, long signal cycles, and limited pedestrian islands create crossing conditions where a single misstep or a single distracted driver produces catastrophic results.
What This Means for Injured Bronx Residents
The crash patterns on Bronx roads are not random. They cluster at specific intersections and along specific corridors where road design, traffic volume, and driver behavior converge. That clustering is legally significant.
When you are injured at a location with a documented history of crashes, the city’s failure to address known dangerous conditions can support a claim of negligence. Prior crash data from NYC Open Data Motor Vehicle Collisions, Vision Zero priority designations, and community board complaints all serve as evidence that the hazard was known.
Note
Claims against the City of New York for dangerous road conditions require a notice of claim filed within 90 days under General Municipal Law § 50-e. The personal injury statute of limitations is three years under CPLR § 214(5).
Missing the 90-day window for government claims permanently bars that theory of recovery, even when fault is clear.
Bronx car accident cases are filed in Bronx Supreme Court at 851 Grand Concourse. The Bronx jury pool draws from the same communities affected by these dangerous roads.
Our firm has handled car accident cases in Bronx County for over 37 years. We know the roads, the courts, and the insurance adjusters who handle Bronx claims.
If you were injured on East 138th Street, Bruckner Boulevard, the Major Deegan, the Grand Concourse, or any other dangerous Bronx road, contact us for a free consultation.
Call 212-221-5999 or request a free case review.
Sources
- NYC Open Data. Motor Vehicle Collisions, Crashes [Dataset]. https://data.cityofnewyork.us/Public-Safety/Motor-Vehicle-Collisions-Crashes/h9gi-nx95
- Transportation Alternatives. (2025). The Most Dangerous Intersections in New York City. https://transalt.org/press-releases/the-most-dangerous-intersections-in-new-york-city-transportation-alternatives-unveils-map-with-brand-new-data
- NYC DOT. (2026). Traffic Deaths Reach All-Time Low. https://www.nyc.gov/html/dot/html/pr2026/traffic-deaths-reach-all-time-low.shtml
- Bronx Times. (2024). Bronx Has NYC's Deadliest Street. https://www.bxtimes.com/bronx-deadliest-street-report/
- NYC DOT. (2023). Vision Zero Borough Pedestrian Safety Action Plan. https://www.nyc.gov/html/dot/html/pr2023/vision-zero-borough-pedestrian-safety-action-plan.shtml
- NYC DOT. (2023). Fordham Road Safety Improvements. https://www.nyc.gov/html/dot/html/about/projects-2019.shtml
- Safe Roads USA. (2023). Bronx Road Safety Overview. https://www.makeroadssafe.org/bronx-road-safety-overview/
- NYC DOT. (2025). Bronx Bike Lane Expansion. https://www.nyc.gov/html/dot/html/bicyclists/bikemain.shtml
Updated June 14, 2026
Frequently asked questions
- What is the most dangerous intersection in the Bronx?
Bruckner Boulevard and St. Ann's Avenue is the most dangerous intersection in the Bronx. Eight people have been killed or seriously injured there in 5 crashes since January 2022, including 5 motorists and 3 pedestrians, according to Transportation Alternatives' December 2025 analysis.
- What is the deadliest road in the Bronx per mile?
East 138th Street has the highest fatality rate per mile of any road in New York City. Twelve people were killed on a 1.5-mile stretch between 2014 and 2023, a rate of 7.1 fatalities per mile. For comparison, Woodhaven Boulevard in Queens had 18 total deaths but only 4.4 per mile.
- How long do I have to file a claim after a Bronx car accident?
You have 30 days to file a no-fault insurance claim. If your accident involved a government entity like the city or MTA, you must file a Notice of Claim within 90 days. The statute of limitations for a personal injury lawsuit is 3 years from the accident date. Missing any of these deadlines can permanently bar your claim.
Injured in NYC? Talk to a Trial Lawyer.
Free consultation. No fee unless we win.
For journalists, researchers, and re-publishers
Use this insight
Cite this insight
Three formats. Click to copy. Use whichever your style guide accepts.
APA AP style BibTeX
Antin, J. S. (2026, March 20). Bronx Car Accident Hotspots: Deadliest Roads. AEE Law Insights. https://aeelaw.com/insights/bronx-car-accident-hotspots/
Contact the data desk
AEE Law editorial desk. Press inquiries answered within one business day.
Contact the data desk
If you were injured in New York and need a lawyer, get Jeff's read on your case.
More from AEE Law Insights
Five Years Later, New York's Traffic Deaths Are Still 18% Above 2019
New York recorded 1,101 traffic deaths in 2024, 17.9% more than the 934 recorded in 2019, the state's pre-pandemic low. Deaths peaked at 1,182 in 2022 and have eased since, but they remain well above where they stood before the pandemic. The decade of steady declines that ran through 2019 has not resumed.
New York's Deadliest Roads Aren't in the City. They're Upstate.
From 2019 to 2023, Genesee County recorded 51 traffic deaths against a population near 58,000, a rate of 88 per 100,000 residents over those five years. Manhattan's five-year rate was 11.5. Genesee's was 7.6 times higher. Thirty counties, nearly all of them rural and upstate, were deadlier per person than any New York City borough, even though the city recorded far more crashes overall.
The NYC E-Bike Injury Ledger: Every Crash, Every Person Hurt
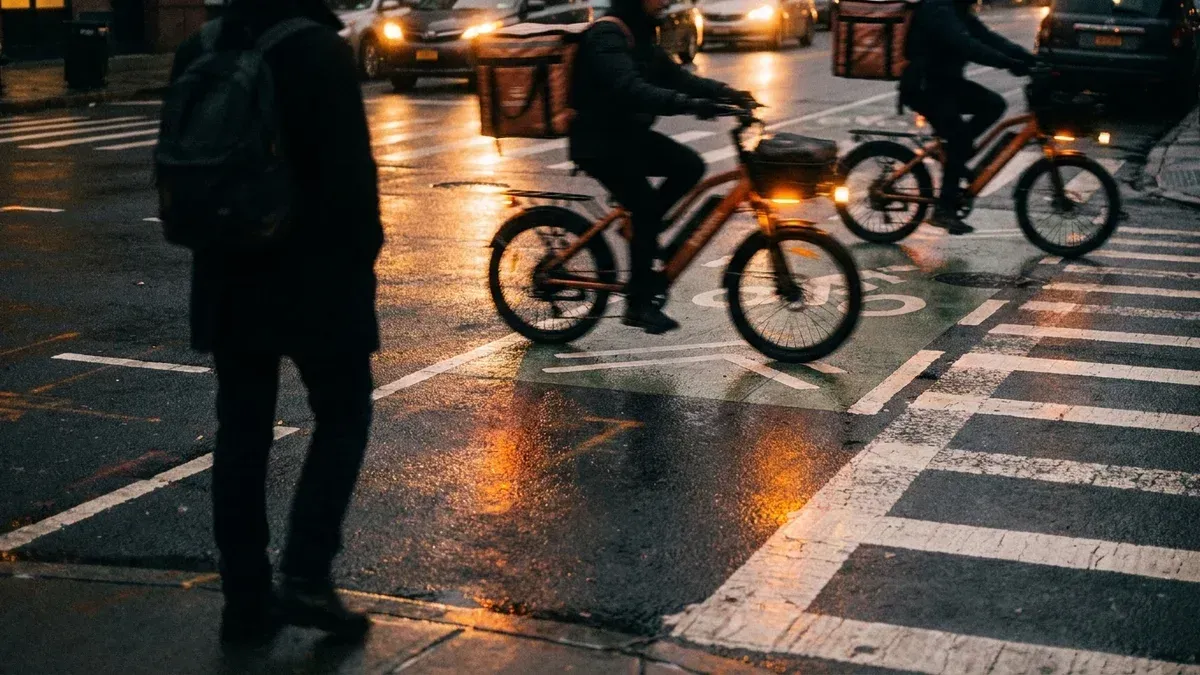
New York's e-bike-involved crashes have injured 17,434 people and killed 133 since 2019, pedestrians and delivery riders alike. This ledger comes from a full review of 2.27 million NYPD collision records, counting e-bike crashes through May 2026. In 2025, eight of the city's 23 cyclist deaths happened in e-bike-involved crashes.