
Crash Data
Queens Car Accident Hotspots: The Deadliest Roads
Queens had 74 traffic deaths in 2024, the most of any NYC borough. Crash data for Northern Blvd, Queens Blvd, the LIE, and Van Wyck Expressway.

In this report
Key Finding
Queens recorded 74 traffic deaths in 2024, the highest of any NYC borough. Northern Blvd and 48th Street is tied for the deadliest intersection in the entire city, with 9 people killed or seriously injured since January 2022.
Key Facts
Queens had 74 traffic deaths in 2024, the highest of any NYC borough. Surpassed Brooklyn (69), Bronx (54), Manhattan (44), and Staten Island (12).
Northern Boulevard and 48th Street is tied for the deadliest intersection in all of New York City. 9 people killed or seriously injured in 5 crashes since January 2022.
Queens accounted for roughly 28% of all NYC crash-related injuries in 2022, second only to Brooklyn at 33%. The two boroughs together produce more than 60% of all NYC injury crashes.
74
Traffic deaths in Queens in 2024, the highest of any NYC borough. Northern Blvd and 48th Street is tied for the deadliest intersection in all of New York City, with 9 people killed or seriously injured since January 2022.
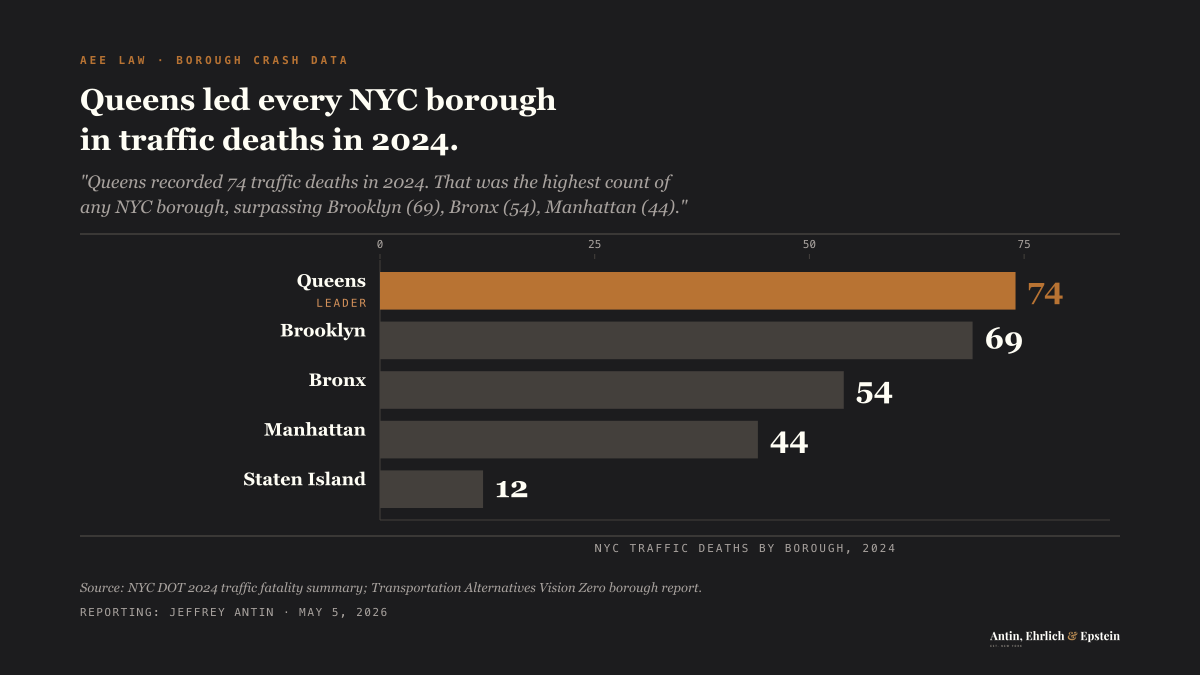
Queens recorded 74 traffic deaths in 2024. That was the highest count of any NYC borough, surpassing Brooklyn(69), the Bronx(54), Manhattan(44), and Staten Island(12). In 2025, the number dropped to 57, but Queens still ranked second behind Brooklyn. The data comes from NYC DOT’s January 2026 report.
The borough’s danger comes from a specific combination: high-speed arterial roads, two major airports generating constant commercial traffic, and wide boulevards that were built for cars, not for the 2.3 million people who live here.
Queens by the Numbers
NYC DOT’s January 2026 report on 2025 traffic fatalities places Queens in the broader context:
| Borough | 2024 Deaths | 2025 Deaths | Change |
|---|---|---|---|
| Queens | 74 | 57 | -23% |
| Brooklyn | 69 | 63 | -9% |
| Bronx | 54 | 33 | -39% |
| Manhattan | 44 | 39 | -11% |
| Staten Island | 12 | 13 | +8% |
Queens accounted for roughly 28% of all NYC crash-related injuries in 2022, second only to Brooklyn at 33%. Together, the two boroughs produce more than 60% of all injury crashes citywide.
NYPD precinct data through December 2023 showed troubling trends in Queens. In Queens South precincts, cycling injuries climbed 35.4% year over year. Pedestrian injuries rose 8.6%. Total injuries were up 5.2%. Queens North precincts saw total injuries rise 11.8%.
Northern Boulevard: The New Boulevard of Death
Transportation Alternatives gave Northern Boulevard that label in September 2018. The data supported the name.
Northern Boulevard and 48th Street is now tied for the deadliest intersection in all of New York City. According to Transportation Alternatives’ December 2025 analysis, nine people have been killed or seriously injured there in five crashes since January 2022: seven motorists, one pedestrian, and one cyclist.
The broader corridor is equally dangerous. In 2021, Northern Boulevard recorded 284 crashes. The worst intersections that year:
| Intersection | Crashes (2021) |
|---|---|
| Northern Blvd & Cross Island Parkway | 17 |
| Northern Blvd & Parsons Boulevard | 11 |
| Northern Blvd & 126th Street | 9 |
| Northern Blvd & Union Street | 9 |
| Northern Blvd & Prince Boulevard | 8 |
Between 2012 and 2016, a 4.3-mile segment of Northern Boulevard produced 1,086 injuries to pedestrians, cyclists, and vehicle occupants. Ten people died on the corridor between the start of 2017 and September 2018.
One statistic captures the core problem: 65% of pedestrian crashes on Northern Boulevard involved people crossing with the signal. The Queens average is 34%. When pedestrians doing everything right still get hit at nearly twice the expected rate, the road’s design is the problem. The NYC DOT Northern Boulevard Safety Study documented this disparity.
NYC DOT has invested in improvements. Thirteen pedestrian islands installed since 2014 reduced pedestrian injuries 51% and total injuries 14% on treated sections. A $79 million redesign of 2.7 miles between Broadway and 114th Street was unveiled in 2021. But crash numbers on the full corridor remain high.
Queens Boulevard: After the Redesign
Queens Boulevard’s history is written in fatalities. Since 1990, at least 186 people have been killed on this road, including 138 pedestrians. In 1997 alone, 18 pedestrians died. The name “Boulevard of Death” stuck because the numbers justified it.
NYC DOT completed a full 7-mile redesign in November 2024 after nine years of phased construction. The project reduced lanes from 12 to 10, lowered the speed limit to 25 mph, added protected bike lanes in both directions, and installed red light and speed cameras.
The results are significant:
- Traffic fatalities decreased 68% on redesigned sections
- Pedestrian injuries dropped 45%
- Overall injuries declined 35%
- Cyclist volumes increased 100-450% across the corridor
- Three calendar years with zero pedestrian or cyclist deaths(2014-2017 period)
A $150 million permanent hardscape project is planned for the Roosevelt Avenue to 73rd Street segment, with construction expected to begin in 2025.
Queens Boulevard is safer. But it is not safe. The corridor still recorded 223 crashes in 2021, producing 1 death and 129 injuries. Dangerous intersections remain:
| Intersection | Crashes (2021) |
|---|---|
| Queens Blvd & Jackson Avenue | 15 |
| Queens Blvd & Woodhaven Boulevard | 14 |
| Queens Blvd & 39th Street | 9 |
| Queens Blvd & 57th Avenue | 9 |
| Queens Blvd & Skillman Avenue | 8 |
The fundamental geometry of Queens Boulevard, up to 300 feet wide in places, still creates long, dangerous pedestrian crossings even with the improvements.
The Long Island Expressway Through Queens
The LIE carries high-speed traffic through the heart of Queens, with dangerous interchange zones where highway driving meets local streets. The same expressway continues east into Long Island, where crash patterns intensify on the less-congested stretches.
Between 2007 and 2016, the expressway recorded more than 600 crashes, with 265 resulting in fatal injuries. Near Maurice Avenue, there were 30 crashes and 15 fatalities in that period.
NYSDOT found that truck drivers frequently pull over to sleep in this area, creating hazards for through traffic. The BQE interchange at Exit 17W recorded another 30 crashes in the same timeframe, with confusion from lane crossing to make exits a leading cause.
The LIE’s stop-and-go congestion produces rear-end collisions throughout the Queens segment. High-speed merges at interchanges create sideswipe and lane-change crashes. Commercial truck traffic adds weight and force to collisions that might otherwise be minor.
Van Wyck Expressway: Airport Traffic and Danger
The Van Wyck carries approximately 110,000 vehicles per day between the Whitestone Expressway and the Kew Gardens interchange. One in twelve of those vehicles during morning rush is a commercial truck serving JFK Airport.
JFK processed 62.6 million passengers in 2025, its second-busiest year ever. LaGuardia handled 32.8 million. Both airports sit entirely within Queens, and the roads serving them bear the consequences.
The Van Wyck’s combination of heavy volume, commercial traffic, confused airport travelers, and rideshare vehicles creates a corridor where rear-end collisions, relentless lane changes, and speed-related crashes are constant. The ongoing $19 billion JFK modernization project adds construction zones and detours that further disrupt traffic flow.
The Conduit Avenue Corridor
The Conduit Avenue corridor along the Brooklyn-Queens border deserves attention. In the past five years, 5 people died and more than 40 suffered severe injuries on a stretch between Atlantic Avenue and Lefferts Boulevard.
Speed cameras along Conduit Avenue log the highest number of speed violations of any location in the city. There are only 15 signalized crossings across the entire 3-mile stretch, and 29 schools sit within half a mile.
In May 2025, NYC DOT launched a community-driven planning process to redesign the corridor, building on speed-limit reductions and new pedestrian signals already in place.
What This Means for Injured Queens Residents
Queens has structural problems that produce predictable crashes. Wide, fast arterial roads designed in an era when pedestrian safety was not a design priority. Two major airports generating constant commercial and rideshare traffic. Expressway interchanges that force split-second lane decisions.
When you are injured in a crash on one of these corridors, the crash history at that location can strengthen your case. A pattern of crashes at the same intersection or stretch of highway can establish that the condition was known and the city, state, or property owner failed to act.
Video evidence matters. Queens has extensive red light and speed camera coverage, plus private surveillance cameras on commercial corridors. Obtaining this footage quickly is critical because it gets overwritten. NYC Open Data Motor Vehicle Collisions lets you look up the crash history at any Queens intersection before filing suit.
Note
Personal injury claims run three years from the crash under CPLR § 214(5). Wrongful death is two years under EPTL § 5-4.1. If city or MTA property, vehicles, or road design contributed to the crash, a Notice of Claim under General Municipal Law § 50-e must be filed within 90 days.
Our firm has represented injured Queens residents in Queens County Supreme Court for over 37 years. We know these roads, these courts, and the insurance adjusters who handle Queens claims. If you were injured on Northern Boulevard, Queens Boulevard, the LIE, or any other dangerous Queens road, contact us for a free consultation.
Call 212-221-5999 or request a free case review.
Sources
- NYC DOT. (2026). Traffic Deaths Reach All-Time Low. https://www.nyc.gov/html/dot/html/pr2026/traffic-deaths-reach-all-time-low.shtml
- Transportation Alternatives. (2025). The Most Dangerous Intersections in New York City: Transportation Alternatives Unveils Map with Brand-New Data. https://transalt.org/press-releases/the-most-dangerous-intersections-in-new-york-city-transportation-alternatives-unveils-map-with-brand-new-data
- NYC DOT. (2024). Complete Queens Boulevard Redesign. https://www.nyc.gov/html/dot/html/pr2024/complete-queens-boulevard-redesign.shtml
- NYC DOT. (2019). Northern Boulevard Safety Improvements: 70th Street to 92nd Street. https://www.nyc.gov/html/dot/downloads/pdf/northern-blvd-70th-st-92nd-st-may2019.pdf
- NYC Open Data. Motor Vehicle Collisions: Crashes. https://data.cityofnewyork.us/Public-Safety/Motor-Vehicle-Collisions-Crashes/h9gi-nx95
- Safe Roads USA. (2023). Queens Road Safety Overview. https://www.makeroadssafe.org/queens-road-safety-overview/
- Port Authority of NY and NJ. (2025). Port Authority's Commercial Airports Record Busiest Year Ever for Second Consecutive Year. https://www.panynj.gov/port-authority/en/press-room/press-release-archives/2025-press-releases/port-authority-s-commercial-airports-record-busiest-year-ever-fo.html
- NYC DOT. (2025). Conduit Corridor Plan. https://www.nyc.gov/html/dot/html/about/conduit-corridor.shtml
- NYSDOT. Van Wyck Expressway DEIS, Chapter 2: Project Context. https://www.dot.ny.gov/vwe/repository/VWE_Project_DEIS_Chapter_2-Project_Context.pdf
Updated June 14, 2026
Frequently asked questions
- Which intersection in Queens is the most dangerous?
Northern Boulevard and 48th Street is tied for the deadliest intersection in all of New York City, with 9 people killed or seriously injured in 5 crashes since January 2022. The crashes injured 7 motorists, 1 pedestrian, and 1 cyclist. This data comes from Transportation Alternatives' December 2025 analysis.
- Is Queens Boulevard still the Boulevard of Death?
Queens Boulevard earned that name after 186 people died on it since 1990, including 138 pedestrians. NYC DOT completed a full 7-mile redesign in November 2024, which reduced traffic fatalities 68% and pedestrian injuries 45% on redesigned sections. The boulevard is safer, but 223 crashes still occurred there in 2021.
- How long do I have to file a claim after a Queens car accident?
You have 30 days to file a no-fault insurance claim. If your accident involved a government entity like the city or MTA, you must file a Notice of Claim within 90 days. The statute of limitations for a personal injury lawsuit is 3 years. Missing any of these deadlines can permanently bar your claim.
Injured in NYC? Talk to a Trial Lawyer.
Free consultation. No fee unless we win.
For journalists, researchers, and re-publishers
Use this insight
Cite this insight
Three formats. Click to copy. Use whichever your style guide accepts.
APA AP style BibTeX
Antin, J. S. (2026, February 23). Queens Car Accident Hotspots: The Deadliest Roads. AEE Law Insights. https://aeelaw.com/insights/queens-car-accident-hotspots/
Contact the data desk
AEE Law editorial desk. Press inquiries answered within one business day.
Contact the data desk
Methodology
Data sources
- NYC DOT January 2026 traffic fatality report (borough-level 2024 totals).
- Transportation Alternatives Most Dangerous Intersections analysis (December 2025), covering January 2022 through October 2025.
- NYC Open Data Motor Vehicle Collisions dataset for crash and injury counts.
Processing notes
Borough fatality counts (Queens 74, Brooklyn 69, Bronx 54, Manhattan 44, Staten Island 12) reflect NYC DOT's 2024 calendar-year totals released in January 2026. Intersection-level rankings come from Transportation Alternatives, which scored intersections by total killed-or-seriously-injured (KSI) victims over the period from January 2022 to October 2025. KSI counts include motorists, pedestrians, and cyclists. Crash-injury share by borough (Queens 28%, Brooklyn 33%) is calculated from NYC Open Data's 2022 collision records, filtered to crashes resulting in at least one reported injury.
Limitations
- NYPD-coded collision data depends on officer reporting at the scene. Single-vehicle and low-injury crashes are undercounted.
- Intersection rankings privilege locations with high vehicle volume. Less-trafficked corridors with high per-crash severity may not surface.
- Port Authority airport traffic counts capture vehicle inflow but not crash causation tied to airport trips specifically.
Peer review
Internal review by Jeffrey Antin. All counts traceable to NYC DOT or NYC Open Data primary sources.
Last updated
2026-05-11
If you were injured in New York and need a lawyer, get Jeff's read on your case.
More from AEE Law Insights
Five Years Later, New York's Traffic Deaths Are Still 18% Above 2019
New York recorded 1,101 traffic deaths in 2024, 17.9% more than the 934 recorded in 2019, the state's pre-pandemic low. Deaths peaked at 1,182 in 2022 and have eased since, but they remain well above where they stood before the pandemic. The decade of steady declines that ran through 2019 has not resumed.

New York's Deadliest Roads Aren't in the City. They're Upstate.
From 2019 to 2023, Genesee County recorded 51 traffic deaths against a population near 58,000, a rate of 88 per 100,000 residents over those five years. Manhattan's five-year rate was 11.5. Genesee's was 7.6 times higher. Thirty counties, nearly all of them rural and upstate, were deadlier per person than any New York City borough, even though the city recorded far more crashes overall.
The NYC E-Bike Injury Ledger: Every Crash, Every Person Hurt
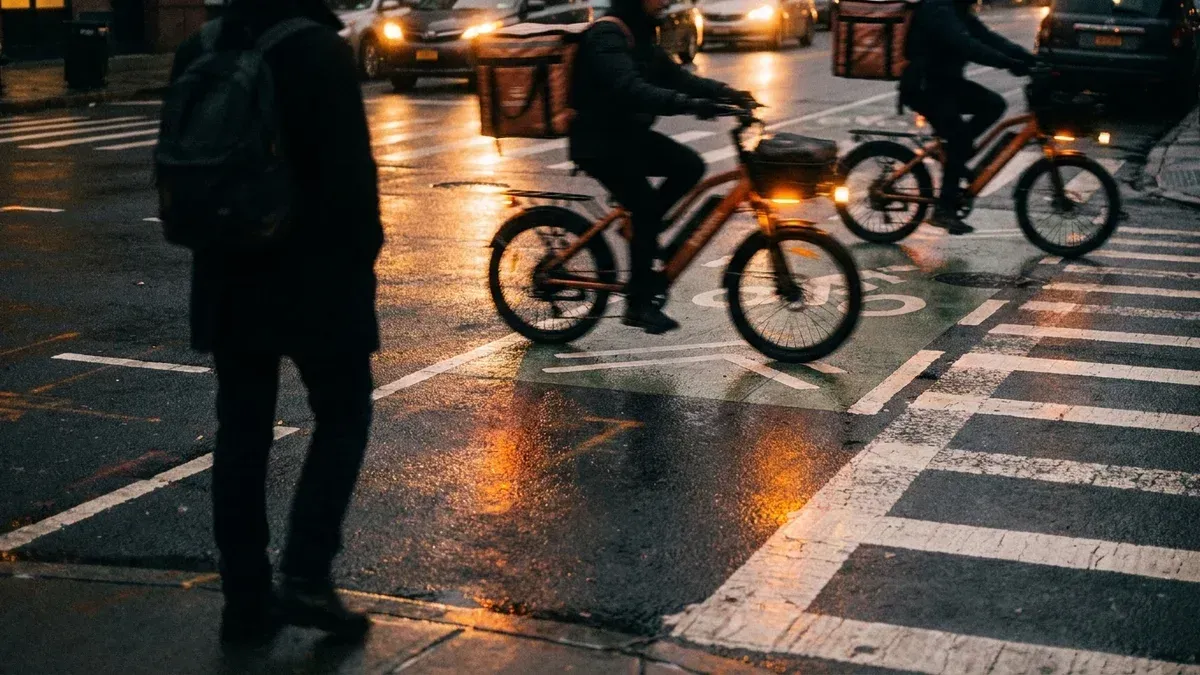
New York's e-bike-involved crashes have injured 17,434 people and killed 133 since 2019, pedestrians and delivery riders alike. This ledger comes from a full review of 2.27 million NYPD collision records, counting e-bike crashes through May 2026. In 2025, eight of the city's 23 cyclist deaths happened in e-bike-involved crashes.