
Crash Data
Brooklyn Bridge Accident Data: Key Stats
Collision patterns on and near the Brooklyn Bridge. Who's most at risk, where crashes cluster, and legal options after a Brooklyn Bridge accident.

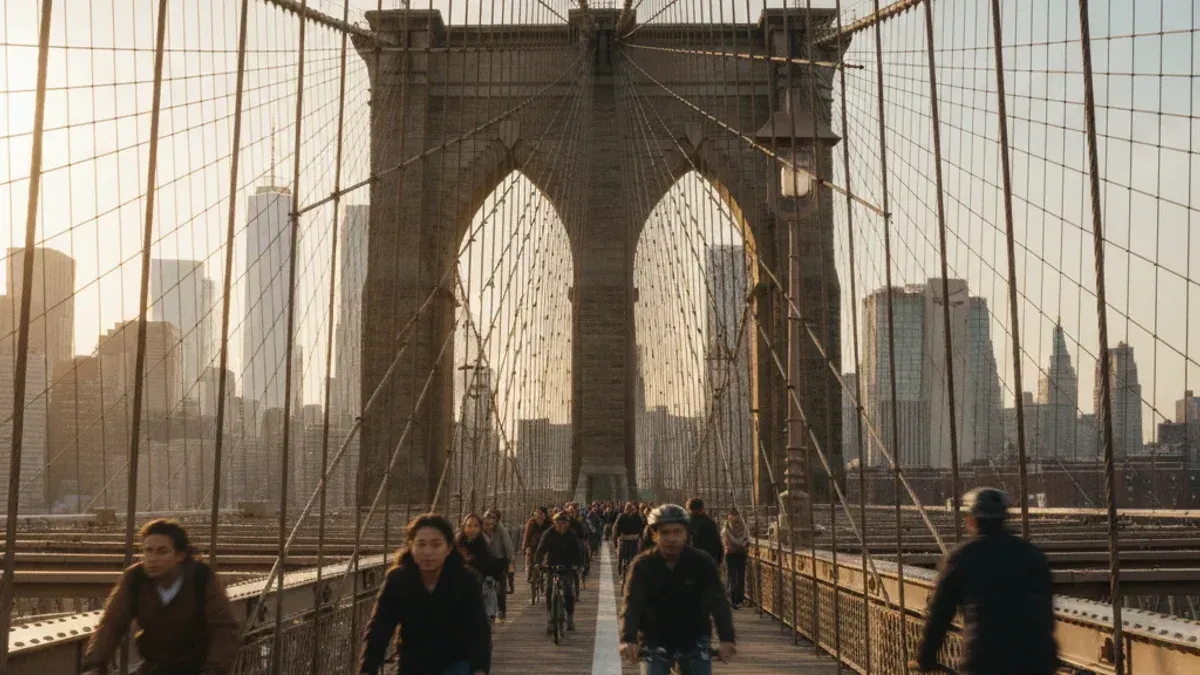
Key Finding
The Brooklyn Bridge corridor sees frequent collisions at its approach intersections, with pedestrians and cyclists facing disproportionate risk at merge points on both the Manhattan and Brooklyn sides.
The Brooklyn Bridge carries more than 100,000 vehicles per day. Add thousands of pedestrians and cyclists sharing the crossing, and you have one of the most congested corridors in New York City.
NYPD collision data, available through NYC Open Data Motor Vehicle Collisions, shows a consistent pattern: crashes cluster at the bridge’s approach intersections on both sides. Pedestrians and cyclists bear a disproportionate share of serious injuries.
Where Crashes Cluster
Collision data reveals distinct crash patterns on and around the Brooklyn Bridge.
- Manhattan-side approaches generate the highest collision volume. Bridge traffic feeds into the City Hall area, where vehicles exiting onto Centre Street, Park Row, and the FDR Drive on-ramp compete with pedestrians and cyclists in a compressed space. Left-turn conflicts near Park Row are a recurring problem.
- Brooklyn-side ramps near Tillary Street and Adams Street create a different hazard. Drivers accelerating onto the bridge merge with traffic exiting the BQE, while pedestrians cross at grade level. Vision Zero has classified the Tillary Street corridor as a priority location.
- On the bridge itself, rear-end collisions dominate. Traffic routinely stops and starts across all lanes. The bridge’s surface becomes slippery in rain and freezing conditions, increasing stopping distances.
Pedestrians Face the Greatest Risk
Pedestrians involved in Brooklyn Bridge corridor crashes suffer more severe injuries than those in vehicle-only collisions.
The most dangerous moments for people on foot near the bridge:
- Morning rush (7:30 to 9:30 AM): People crossing to reach the courts, government buildings, and offices around City Hall face turning vehicles exiting the bridge.
- Evening rush (5:00 to 7:00 PM): The reverse flow brings higher pedestrian volumes as commuters crowd the approaches.
- Weekends and holidays: Tourist foot traffic on the bridge path surges. Conflicts between cyclists traveling at speed and groups of slow-moving pedestrians produce falls and injuries.
Most pedestrian crashes near the Brooklyn Bridge involve vehicles making turns. Drivers focused on merging into bridge traffic fail to yield to people in crosswalks. Large vehicle blind spots are the deadliest factor. Trucks and SUVs that can’t see pedestrians beside them during turns account for the most severe injuries.
The Cyclist Picture
Since the city redesigned the Brooklyn Bridge to give cyclists their own lane on the Manhattan-bound roadway in 2021, cyclist-vehicle collisions on the bridge deck have decreased. The approaches remain dangerous.
On the Brooklyn side, cyclists riding down from the bridge path merge into Tillary Street traffic. It’s a fast-moving, multi-lane road with a history of serious cycling crashes. Riders go from a protected bridge path to unprotected street riding, and that shift catches many off guard.
On the Manhattan side, cyclists exiting the bridge funnel into the bike lane network around City Hall. The transition points where protected bike infrastructure ends and mixed traffic begins are where crashes cluster.
Bike-pedestrian conflicts on the bridge path produce a separate category of injuries. The 2021 redesign improved conditions by separating cyclists from pedestrians, but tourist congestion still forces cyclists to brake suddenly or swerve, resulting in falls that cause broken bones and head injuries.
Why This Corridor Is Dangerous
Several factors converge at the Brooklyn Bridge:
- Old design. The bridge opened in 1883. Its approaches have been rebuilt many times but still lack modern safety features. Merge points are tight. Sight lines are blocked. Crosswalks sit where cars move fastest.
- Tourist distraction. Drivers gawking at the bridge cause rear-end crashes. Walkers on the bridge path stop for photos, causing pile-ups. Millions of tourists visit each year. That volume makes it worse.
- Signal timing that favors cars. Traffic signals at the approaches keep vehicles moving. Pedestrian crossing phases are short. People who can’t cross in time get caught in the intersection.
- Weather and the steel deck. Parts of the roadway are open steel grating, which gets slick in rain, snow, and ice. Ice forms on the bridge before it forms on nearby roads because wind hits the bridge first.
What the City Has Done
NYC DOT has taken several steps to address Brooklyn Bridge safety:
- The 2021 bike lane redesign moved cyclists from the shared upper path to a dedicated lane on the Manhattan-bound roadway, reducing bike-pedestrian conflicts but eliminating a vehicle travel lane.
- Signal timing adjustments at Tillary Street and Adams Street added longer pedestrian crossing phases and leading pedestrian intervals.
- Speed cameras were installed on the bridge approaches.
- Protected bike infrastructure along Tillary Street has been proposed but not yet fully built.
Despite these changes, the fundamental challenge remains: too much traffic of every kind converging at bottleneck points where the bridge meets city streets.
Your Rights After a Brooklyn Bridge Crash
Brooklyn Bridge collisions can involve multiple liable parties:
- Another driver: distraction, failure to yield, or following too closely
- NYC government: dangerous road design, bad signage, signal timing, or failure to maintain the bridge surface
- Vehicle makers: cases involving brake failure or other defects
Claims against the city require filing a Notice of Claim within 90 days under General Municipal Law § 50-e. This deadline is strictly enforced. Missing it can bar your case entirely, regardless of how severe your injuries are.
Pedestrians and cyclists struck by a vehicle are “covered persons” under Insurance Law § 5102(j) , so the “ serious injury ” threshold under Insurance Law § 5102(d) still applies to a claim for pain and suffering.
In practice, the injuries a struck pedestrian or cyclist suffers, fractures, permanent loss of use, and traumatic brain injury, almost always meet that threshold, so it rarely becomes the contested issue.
The personal injury statute of limitations is three years under CPLR § 214(5). Government claims must be filed within one year and 90 days after the date of the incident under General Municipal Law § 50-i , not from when the notice of claim was served.
Note
The NYC Vision Zero View interactive map lets you search crash history at any specific Brooklyn Bridge approach intersection. This publicly available data can establish that the City had knowledge of a dangerous condition, which is a key element of a government liability claim.
Frequently Asked Questions
Are Brooklyn Bridge pedestrian crashes increasing?
Results are mixed. While the 2021 redesign improved some metrics, crash volumes at the bridge approaches have not dropped much. Pedestrian-struck crashes remain a persistent problem at turning conflict points on the Manhattan side.
Who maintains the Brooklyn Bridge?
The NYC Department of Transportation is responsible for the bridge’s roadway, signals, and pedestrian infrastructure. The city can be liable for crashes caused by maintenance failures: ice that isn’t treated, potholes on the approaches, malfunctioning signals, or deteriorated lane markings.
What should I do if I’m hit on or near the Brooklyn Bridge?
Call 911 and get medical attention, even if injuries seem minor. Document the scene with photos, including the exact location on or near the bridge. Get the other party’s information and contact details for any witnesses.
Request the NYPD accident report. Do not give a recorded statement to any insurance company before speaking with a lawyer.
Sources
- NYC Open Data. (2023). Motor Vehicle Collisions, Crashes [Dataset]. https://data.cityofnewyork.us/Public-Safety/Motor-Vehicle-Collisions-Crashes/h9gi-nx95
- NYC DOT. (January 2026). Traffic Deaths Reach All-Time Low. https://www.nyc.gov/html/dot/html/pr2026/traffic-deaths-reach-all-time-low.shtml
- NYC DOT. Vision Zero View [Interactive Map]. https://www.nyc.gov/content/visionzero/pages/data
- Transportation Alternatives. (2025). Serious Injuries, Q3 2025. https://transalt.org/press-releases/serious-injuries-q3-2025
Updated June 14, 2026
Frequently asked questions
- Are Brooklyn Bridge pedestrian crashes increasing?
Results are mixed. While the 2021 redesign improved some metrics, crash volumes at the bridge approaches have not dropped much. Pedestrian-struck crashes remain a persistent problem at turning conflict points on the Manhattan side.
- Who maintains the Brooklyn Bridge?
The NYC Department of Transportation is responsible for the bridge's roadway, signals, and pedestrian infrastructure. The city can be liable for crashes caused by maintenance failures: ice that isn't treated, potholes on the approaches, malfunctioning signals, or deteriorated lane markings.
- What should I do if I'm hit on or near the Brooklyn Bridge?
Call 911 and get medical attention, even if injuries seem minor. Document the scene with photos, including the exact location on or near the bridge. Get the other party's information and contact details for any witnesses. Request the NYPD accident report. Do not give a recorded statement to any insurance company before speaking with a lawyer.
Injured in NYC? Talk to a Trial Lawyer.
Free consultation. No fee unless we win.
For journalists, researchers, and re-publishers
Use this insight
Cite this insight
Three formats. Click to copy. Use whichever your style guide accepts.
APA AP style BibTeX
Antin, J. S. (2026, February 11). Brooklyn Bridge Accident Data: Key Stats. AEE Law Insights. https://aeelaw.com/insights/brooklyn-bridge-accidents/
Contact the data desk
AEE Law editorial desk. Press inquiries answered within one business day.
Contact the data desk
If you were injured in New York and need a lawyer, get Jeff's read on your case.
More from AEE Law Insights
Five Years Later, New York's Traffic Deaths Are Still 18% Above 2019
New York recorded 1,101 traffic deaths in 2024, 17.9% more than the 934 recorded in 2019, the state's pre-pandemic low. Deaths peaked at 1,182 in 2022 and have eased since, but they remain well above where they stood before the pandemic. The decade of steady declines that ran through 2019 has not resumed.
New York's Deadliest Roads Aren't in the City. They're Upstate.
From 2019 to 2023, Genesee County recorded 51 traffic deaths against a population near 58,000, a rate of 88 per 100,000 residents over those five years. Manhattan's five-year rate was 11.5. Genesee's was 7.6 times higher. Thirty counties, nearly all of them rural and upstate, were deadlier per person than any New York City borough, even though the city recorded far more crashes overall.
The NYC E-Bike Injury Ledger: Every Crash, Every Person Hurt
New York's e-bike-involved crashes have injured 17,434 people and killed 133 since 2019, pedestrians and delivery riders alike. This ledger comes from a full review of 2.27 million NYPD collision records, counting e-bike crashes through May 2026. In 2025, eight of the city's 23 cyclist deaths happened in e-bike-involved crashes.