
Crash Data
Staten Island Car Accident Hotspots
Staten Island was the only NYC borough where traffic deaths rose in 2025. Crash data for Hylan Boulevard, the SIE, and the deadliest intersections.

In this report
Key Finding
Staten Island was the only NYC borough where traffic fatalities increased in 2025, rising from 12 to 13 deaths. Hylan Boulevard, the borough's longest road at approximately 14 miles, is the most crash-prone corridor. The borough's car-dependent design and limited transit infrastructure produce higher per-capita vehicle crash rates than denser boroughs.
Key Facts
Staten Island was the only NYC borough where traffic fatalities rose in 2025. Every other borough saw declines.
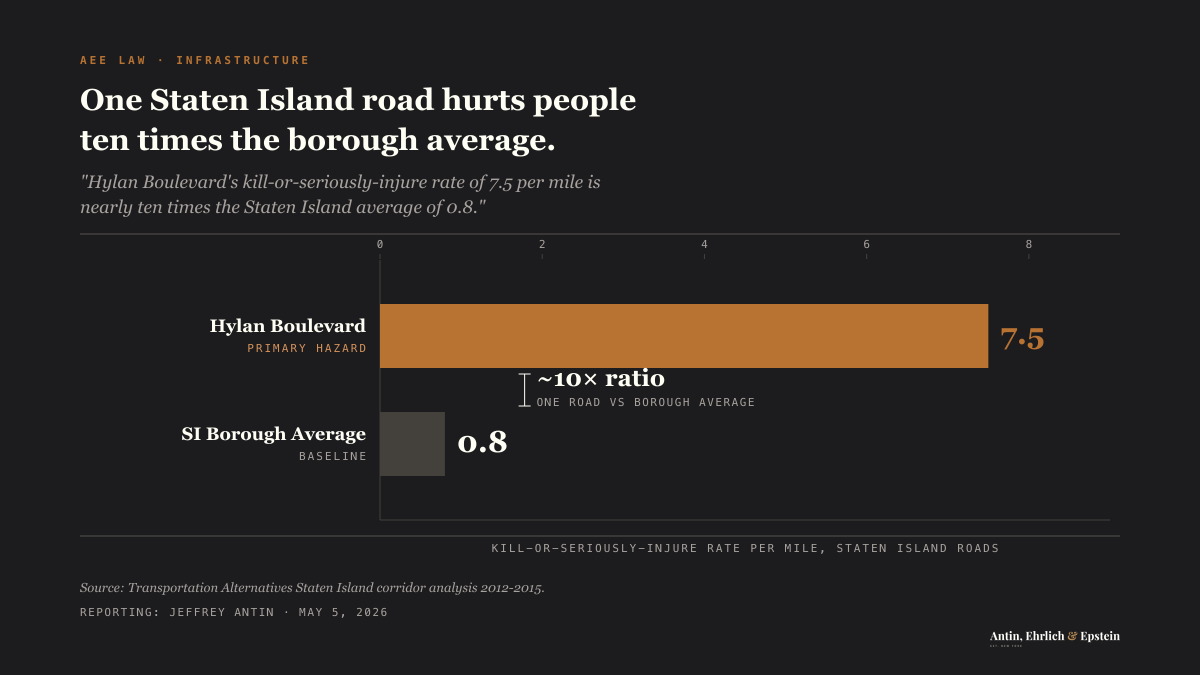
The deadliest Hylan Boulevard segment, Satterlee Street to Page Avenue, runs a kill-or-seriously-injure rate of 7.5 per mile, more than 9 times the Staten Island borough average of 0.8.
In Transportation Alternatives’ 2012 to 2015 corridor data, six of the ten most dangerous intersections on Staten Island sit on Hylan Boulevard. Over that window, the road produced 1,231 injuries and 14 fatalities.
+8%
Traffic fatality change in Staten Island in 2025, the only NYC borough where deaths rose. Every other borough saw declines. The deadliest Hylan Boulevard segment, Satterlee Street to Page Avenue, runs a kill-or-seriously-injure rate of 7.5 per mile, more than 9x the borough average of 0.8.
Staten Island was the only New York City borough where traffic fatalities increased in 2025. Brooklyn, Queens, the Bronx, and Manhattan all recorded fewer deaths.
Staten Island went from 12 to 13. An 8% increase in a year when every other borough improved. The full borough breakdown is in NYC DOT’s January 2026 traffic fatalities report.
The raw numbers are smaller than the other boroughs. Staten Island has roughly 498,000 residents, the smallest population of the five. But the per-capita numbers tell a different story.
Residents are more car-dependent than any other borough. 83% of households own a car, the highest rate of any borough. Manhattan is 22%.
Sixty-four percent of commuters drive to work, compared to less than 30% citywide. More driving means more exposure. The borough’s road design reflects its suburban character: wide lanes, high speeds, strip-mall arterials, and long distances between crosswalks.
Staten Island by the Numbers
NYC DOT’s January 2026 report on 2025 traffic fatalities:
| Borough | 2024 Deaths | 2025 Deaths | Change |
|---|---|---|---|
| Queens | 74 | 57 | -23% |
| Brooklyn | 69 | 63 | -9% |
| Bronx | 54 | 33 | -39% |
| Manhattan | 44 | 39 | -11% |
| Staten Island | 12 | 13 | +8% |
Every other borough moved in the right direction. Staten Island moved in the wrong one.
The borough recorded approximately 3,800 total crashes in 2024, with roughly 1,600 resulting in injuries. Those numbers are lower than the other boroughs in absolute terms. But Staten Island has fewer road miles. The crash rate per vehicle mile driven is comparable to the citywide average. In some corridors, it exceeds it.
Contributing factors in Staten Island crashes follow a pattern driven by road design and driving culture:
| Cause | Share of Crashes |
|---|---|
| Distracted driving | 32% |
| Failure to yield | 18% |
| Unsafe speed | 15% |
| Following too closely | 12% |
| Running red lights/stop signs | 8% |
| Intoxication | 5% |
Speed is a larger factor on Staten Island than in the denser boroughs. The wide, straight roads encourage it. Posted limits of 25 mph are routinely exceeded on arterials like Hylan Boulevard, Richmond Avenue, and Victory Boulevard.
Hylan Boulevard: The Borough’s Most Dangerous Corridor
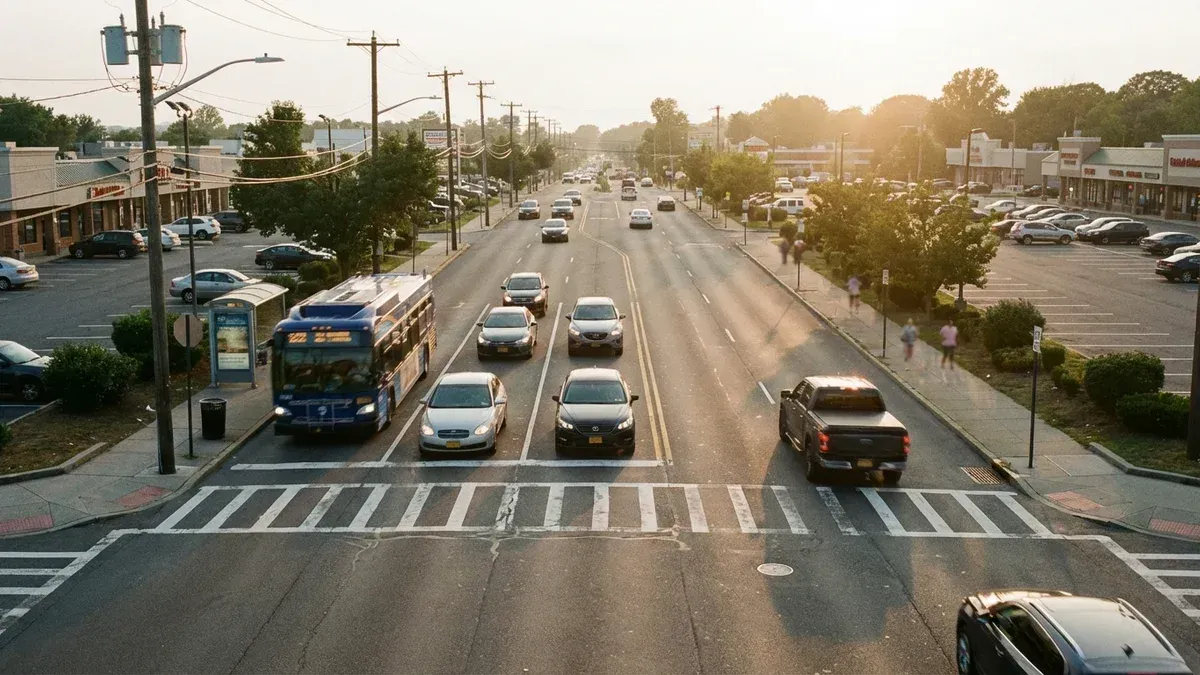
Hylan Boulevard stretches approximately 14 miles along Staten Island’s eastern shore, from St. George in the north to Tottenville at the southern tip. It’s the longest street in any single NYC borough. By total crash volume, it’s the most dangerous road on Staten Island. Transportation Alternatives has called it the “ Boulevard of Death.”
The numbers bear that out. Between 2012 and 2015, Hylan Boulevard produced 1,231 injuries and 14 fatalities, per the Transportation Alternatives corridor analysis. The road carries approximately 44,000 vehicles per day at peak intersections.
Its deadliest stretch, the Satterlee Street to Page Avenue segment, runs a kill-or-seriously-injure rate of 7.5 per mile. That’s more than nine times the Staten Island average of 0.8 and over two and a half times the citywide average of 2.9, per NYC DOT’s Hylan Boulevard street improvement project.
The NYC DOT Vision Zero Staten Island Pedestrian Safety Action Plan documents the corridor’s danger.
In the Transportation Alternatives 2012 to 2015 corridor data, six of the ten most dangerous intersections on Staten Island sit on Hylan Boulevard:
| Intersection | Crashes |
|---|---|
| Hylan Blvd & Allison/Ebbitts St | 43 |
| Hylan Blvd & New Dorp Lane | 37 |
| Hylan Blvd & Nelson Ave | 29 |
| Hylan Blvd & Richmond Ave | 28 |
| Hylan Blvd & Guyon Ave | 22 |
| Hylan Blvd & Old Town Rd | 22 |
The commercial stretches between New Dorp Lane and Nelson Avenue concentrate the worst of it. These sections combine:
- Strip-mall driveways that force left turns across traffic
- Bus stops where MTA buses pull in and out of traffic lanes
- Wide lanes that encourage speeds above the posted 25 mph limit
- Long blocks with few signalized crosswalks for pedestrians
Speed cameras along Hylan Boulevard issue some of the highest violation volumes on Staten Island, a measure of how routinely drivers exceed the posted limit on the corridor.
Cyclists account for only 1% of traffic on Hylan Boulevard but suffer 12% of injuries. The road has no protected bike infrastructure along most of its length.
In 2022, NYC DOT moved to narrow the section between Satterlee Street and Page Avenue from four lanes to three, adding bike lanes and left-turn bays. DOT pointed to comparable road diets elsewhere in the city to justify the change. On Allerton Avenue in the Bronx, the same kind of conversion cut injury crashes 28%.
Staten Island Expressway: Highway Risk
The Staten Island Expressway (I-278) is the borough’s only major highway, connecting the Verrazano-Narrows Bridge to the Goethals Bridge.
In 2023, NYPD collision data recorded 407 crashes on the expressway: 131 resulted in injuries and 1 in a fatality. Speeding is cited as a leading factor in more than half of serious crashes on this road.
The expressway was built in the 1960s with a capacity it now far exceeds. Rush-hour congestion produces rear-end collisions. The merge zones at the Verrazano approach and the Goethals Bridge toll plaza are the highest-crash segments.
Recent fatal crashes illustrate the severity. In September 2023, two 22-year-old women were killed when a Corvette lost control near Hylan Boulevard, struck a barrier, overturned, and caught fire.
In October 2025, three men ages 25 to 27 died when their vehicle lost control near Victory Boulevard at 4:19 a.m. It hit a barrier and overturned.
Truck traffic on the expressway is disproportionate. The road is a key freight corridor between port facilities in Elizabeth, New Jersey and the rest of the metro area.
Large trucks in mixed traffic on a congested, aging highway produce severe crashes. When a tractor-trailer rear-ends a sedan on the expressway at even moderate speed, the injury severity escalates sharply.
Richmond Avenue and Victory Boulevard
Two north-south and east-west arterials account for a significant share of Staten Island’s off-expressway crashes.
Richmond Avenue
Richmond Avenue runs approximately 7 miles through the central spine of Staten Island, from Bulls Head to Tottenville. The road passes through the Staten Island Mall area, one of the borough’s busiest commercial zones. Turning movements into and out of parking lots create constant conflict.
The section near the Mall and Richmond Avenue/Platinum Avenue is a crash cluster. Drivers exiting the Mall merge into fast-moving arterial traffic. Pedestrians crossing Richmond Avenue to reach bus stops face a four-lane road with limited refuge islands.
South of the commercial zone, Richmond Avenue narrows and passes through residential areas where speed remains high. The transition from commercial to residential creates a mismatch between road design and actual conditions.
Victory Boulevard
Victory Boulevard runs east-west across the northern half of Staten Island. It connects the ferry terminal area to the expressway and western neighborhoods. The road carries heavy commuter traffic during morning and evening rush.
The intersection of Victory Boulevard and Jewett Avenue is flagged as a Vision Zero priority location. The geometry forces complicated turning movements. Pedestrian crossing distances exceed 60 feet.
Pedestrian Risk on Staten Island
Pedestrian crashes on Staten Island follow a pattern shaped by the borough’s suburban road network. Unlike Manhattan, where pedestrian crashes happen at dense intersections, Staten Island pedestrian crashes often happen mid-block.
The reason: crosswalks are spaced far apart. A pedestrian who needs to cross Hylan Boulevard may face a quarter-mile walk to the nearest signalized crossing. Many choose to cross mid-block instead. That puts them in a road environment where drivers are traveling at 35 to 40 mph and not expecting someone on foot.
Senior citizens are disproportionately affected. Staten Island has one of the oldest population profiles of the five boroughs. Older pedestrians are more vulnerable to severe injury and death when struck. The borough’s limited sidewalk network in some neighborhoods forces pedestrians onto road shoulders, adding further risk.
In 2024, pedestrian fatalities on Staten Island included crashes on Hylan Boulevard, Victory Boulevard, and Arthur Kill Road. Several involved drivers making left turns at intersections where pedestrian signal timing was inadequate.
The Cycling Gap
Staten Island has the least bicycle infrastructure of any NYC borough. The borough has no protected bike lanes on its major arterials. Cycling on Hylan Boulevard, Richmond Avenue, or Victory Boulevard means riding in mixed traffic at speeds that regularly exceed 35 mph.
In 2024, approximately 120 cyclists were injured on Staten Island. Given the borough’s low cycling mode share, this number reflects the danger per trip rather than aggregate volume.
The borough’s geography works against cycling infrastructure. Distances between destinations are long. Hills in the central ridge make casual cycling impractical for many trips. But the lack of any protected infrastructure means cyclists who do ride, including delivery workers on e-bikes, face conditions more experienced cycling cities would consider unacceptable.
DWI: A Persistent Problem
Driving while intoxicated accounts for a larger share of fatal crashes on Staten Island than in any other borough. The car-dependent culture combines with limited late-night transit options. After midnight, the only way off or onto Staten Island by transit is the Staten Island Ferry, service every 30 minutes. No subway service.
Multiple fatal crashes on Staten Island in recent years have involved intoxicated drivers. The pattern is consistent: late-night or early-morning hours, high-speed arterials, and drivers who chose to drive because the alternatives were inconvenient or unavailable.
What This Means for Injured Staten Island Residents
Staten Island’s crash patterns are shaped by infrastructure, not randomness. Wide roads designed for speed, commercial corridors without pedestrian protection, and a car-dependent borough that lacks the transit alternatives available in the rest of the city.
When you’re injured at a location with a documented crash history, the city’s failure to address known dangerous conditions can support a negligence claim. Prior crash data from NYC Open Data Motor Vehicle Collisions, Vision Zero priority designations, and community board requests for safety improvements all serve as evidence.
Note
Personal injury claims have a three-year statute of limitations under CPLR § 214(5). Wrongful death is two years under EPTL § 5-4.1. If road design, a city vehicle, or MTA equipment contributed to your crash, a Notice of Claim under General Municipal Law § 50-e must be filed within 90 days.
Staten Island car accident cases are filed in Richmond County Supreme Court at 18 Richmond Terrace. The courthouse is steps from the ferry terminal. We’ve handled car accident cases across all five boroughs for more than 25 years. We know the roads, the courts, and the insurance adjusters who handle Staten Island claims.
If you were injured on Hylan Boulevard, the Staten Island Expressway, Richmond Avenue, Victory Boulevard, or any other dangerous Staten Island road, contact us for a free consultation.
Call 212-221-5999 or request a free case review.
Sources
- NYC Open Data. Motor Vehicle Collisions, Crashes: Dataset. https://data.cityofnewyork.us/Public-Safety/Motor-Vehicle-Collisions-Crashes/h9gi-nx95
- NYC DOT. (2026). Traffic Deaths Reach All-Time Low. https://www.nyc.gov/html/dot/html/pr2026/traffic-deaths-reach-all-time-low.shtml
- Transportation Alternatives. Zero on Hylan: Hylan Boulevard Corridor Analysis. https://act.transalt.org/a/zero-on-hylan
- NYC DOT. (2022). Hylan Boulevard Street Improvement Project. https://www.nyc.gov/html/dot/downloads/pdf/hylan-blvd-street-improvement-project-jun2022.pdf
- NYC DOT. (2023). Vision Zero Staten Island Pedestrian Safety Action Plan. https://www.nyc.gov/html/dot/html/pr2023/vision-zero-borough-pedestrian-safety-action-plan.shtml
- NYPD. Staten Island Traffic Collision Data. https://www.nyc.gov/assets/nypd/downloads/pdf/traffic_data/sihacc-en-us.pdf
- Staten Island Advance. Staten Island Traffic and Transit: News Coverage Archive. https://www.silive.com/topic/staten-island-traffic-and-transit/index.html
Updated June 14, 2026
Frequently asked questions
- What is the most dangerous road on Staten Island?
Hylan Boulevard is the most dangerous road on Staten Island by total crash volume. The 14-mile road runs the length of the borough's eastern shore, carrying 44,000 vehicles per day at peak intersections. In Transportation Alternatives' 2012 to 2015 corridor data, six of the ten most dangerous intersections on Staten Island sit on Hylan Boulevard, and the road produced 1,231 injuries and 14 fatalities. Its deadliest stretch, the Satterlee Street to Page Avenue segment, runs a kill-or-seriously-injure rate of 7.5 per mile, more than nine times the borough average, per NYC DOT.
- Why did Staten Island traffic deaths increase when other boroughs improved?
Staten Island was the only NYC borough where traffic fatalities rose in 2025, going from 12 to 13 deaths while every other borough saw declines. The borough's car-dependent infrastructure, limited transit options, and wide suburban-style roads encourage higher speeds. Vision Zero safety improvements have been slower to reach Staten Island compared to the denser boroughs.
- How long do I have to file a claim after a Staten Island car accident?
You have 30 days to file a no-fault insurance claim. If your accident involved a government vehicle or road defect, you must file a Notice of Claim within 90 days. The statute of limitations for a personal injury lawsuit is 3 years from the accident date. Missing any of these deadlines can permanently bar your claim.
Injured in NYC? Talk to a Trial Lawyer.
Free consultation. No fee unless we win.
For journalists, researchers, and re-publishers
Use this insight
Cite this insight
Three formats. Click to copy. Use whichever your style guide accepts.
APA AP style BibTeX
Antin, J. S. (2026, March 23). Staten Island Car Accident Hotspots. AEE Law Insights. https://aeelaw.com/insights/staten-island-car-accident-hotspots/
Contact the data desk
AEE Law editorial desk. Press inquiries answered within one business day.
Contact the data desk
Methodology
Data sources
- NYC DOT January 2026 traffic fatality report (Staten Island year-over-year 12 to 13).
- Transportation Alternatives Hylan Boulevard corridor analysis (2012 to 2015, the most recent complete corridor study) for the intersection ranking and corridor injury totals.
- NYC DOT Hylan Boulevard Street Improvement Project (2022) for the 7.5 per mile segment rate (Satterlee Street to Page Avenue).
- NYC Open Data Motor Vehicle Collisions dataset for borough-wide crash records.
- NYC DOT Vision Zero Staten Island Pedestrian Safety Action Plan for arterial designations.
Processing notes
Borough fatality counts (12 in 2024, 13 in 2025) come from NYC DOT's annual press release. The kill-or-seriously-injure rate of 7.5 per mile is NYC DOT's figure for the Hylan Boulevard segment between Satterlee Street and Page Avenue, against a Staten Island borough average of 0.8 and a citywide average of 2.9. Intersection rankings (six of ten on Hylan) come from Transportation Alternatives' 2012 to 2015 corridor analysis, scored by total killed-or-seriously-injured count. Household vehicle ownership (83% Staten Island, 22% Manhattan) is from American Community Survey 5-year estimates.
Limitations
- The 7.5 per mile rate applies to the Hylan Boulevard segment between Satterlee Street and Page Avenue, not the full corridor. The intersection ranking relies on the 2012 to 2015 corridor window. Conditions may have shifted under more recent DOT safety projects.
- Per-capita rates depend on resident population. Through-traffic from New Jersey and other boroughs is not isolated in the denominator.
- NYPD collision coding can misclassify crashes on the SIE between Staten Island and adjacent jurisdictions.
Peer review
Internal review by Jeffrey Antin. Source data drawn from NYC DOT and Transportation Alternatives published analyses.
Last updated
2026-05-11
If you were injured in New York and need a lawyer, get Jeff's read on your case.
More from AEE Law Insights
Five Years Later, New York's Traffic Deaths Are Still 18% Above 2019
New York recorded 1,101 traffic deaths in 2024, 17.9% more than the 934 recorded in 2019, the state's pre-pandemic low. Deaths peaked at 1,182 in 2022 and have eased since, but they remain well above where they stood before the pandemic. The decade of steady declines that ran through 2019 has not resumed.

New York's Deadliest Roads Aren't in the City. They're Upstate.
From 2019 to 2023, Genesee County recorded 51 traffic deaths against a population near 58,000, a rate of 88 per 100,000 residents over those five years. Manhattan's five-year rate was 11.5. Genesee's was 7.6 times higher. Thirty counties, nearly all of them rural and upstate, were deadlier per person than any New York City borough, even though the city recorded far more crashes overall.

The NYC E-Bike Injury Ledger: Every Crash, Every Person Hurt
New York's e-bike-involved crashes have injured 17,434 people and killed 133 since 2019, pedestrians and delivery riders alike. This ledger comes from a full review of 2.27 million NYPD collision records, counting e-bike crashes through May 2026. In 2025, eight of the city's 23 cyclist deaths happened in e-bike-involved crashes.